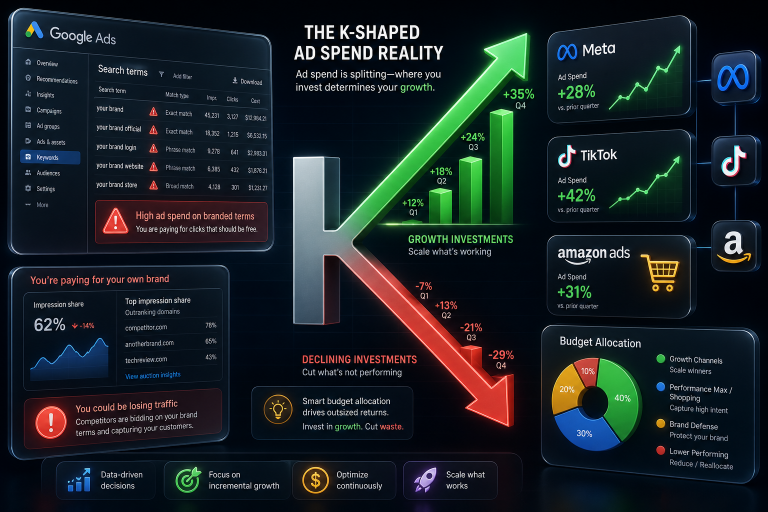
The US advertising market is growing, but unevenly. According to MediaPost, total ad spend increased by 1.9%, while the top 10 advertising categories grew by 4% — nearly double the market rate. This is a K-shaped economy: some categories and channels accelerate, while others stagnate. For media buyers and affiliate marketers, this means blind scaling using old models — pouring more budget into what “used to work” — leads to wasted spend. Especially when “working” means brand queries in Google Ads that cannibalize organic traffic and bring zero incremental revenue. A case study of the Esker brand, analyzed by agency Navigo, shows that cutting the ad budget by 31% and reallocating it across platforms led to a 40% ROAS increase in under 60 days. One branded Google query was burning $50,000 a month with no incremental return. In this article, we’ll break down how to diagnose these budget leaks, reallocate spend across funnel stages, and apply the same principles to affiliate media buying. ## What is the K-Shaped Ad Economy A K-shaped economy is a macro-pattern where different market segments move in opposite directions: some rise, others fall, forming the shape of the letter K on a chart. In advertising, this manifests as major brands and highly competitive categories (retail, FMCG, finance) increasing spend and hoarding more inventory, while niche and mid-tier players cut budgets or abandon platforms. According to MediaPost data from July 2, 2026, the overall market grew by 1.9%, but the top 10 categories grew by 4%. This means ad dollar concentration is intensifying. For media buyers, the consequences are twofold: – CPCs are rising in “thick” niches because big players are willing to pay more per click. – Opportunities are emerging in the “long tail” — categories and GEOs that big brands haven’t reached yet or where they won’t compete on bids. The practical takeaway: if you operate in a vertical invaded by big-budget brands, you must either change your angle (long-tail keywords, Google Display Network, alternative platforms) or reallocate your budget to less competitive segments. ## Branded Queries in Google Ads: The Ultimate Budget Trap The Esker case isn’t unique. Many brands and media buyers overinvest in branded Google queries, assuming that a high ROAS on these terms means efficiency. In reality, branded traffic mostly cannibalizes organic clicks: a user who types a brand name into search would almost certainly click the organic link anyway. A paid click in this case isn’t incremental revenue; it’s an extra cost. Navigo found that one branded Google term was burning $50,000 a month with zero incremental return. This means every dollar spent on that query didn’t bring in new customers — it simply intercepted those who would have arrived organically. ### How to Diagnose Brand Traffic Cannibalization 1. Compare organic CTR for branded queries with the branded campaign turned on and off. If organic CTR recovers after pausing ads, you’re paying for what you would have gotten for free. 2. Measure incrementality through a geo-test. Pause branded ads in one region and compare total conversions (organic + paid) against a control region. 3. Check the Search Terms Report. If 80%+ of impressions are exact matches to your brand, you aren’t expanding reach — you’re just retaining existing demand. For affiliate marketers, this is less relevant (since there usually are no branded queries), but a similar trap exists: paying for traffic to landing pages that already receive organic or referral traffic. If you don’t isolate your sources, you won’t understand which channel actually drives conversions.
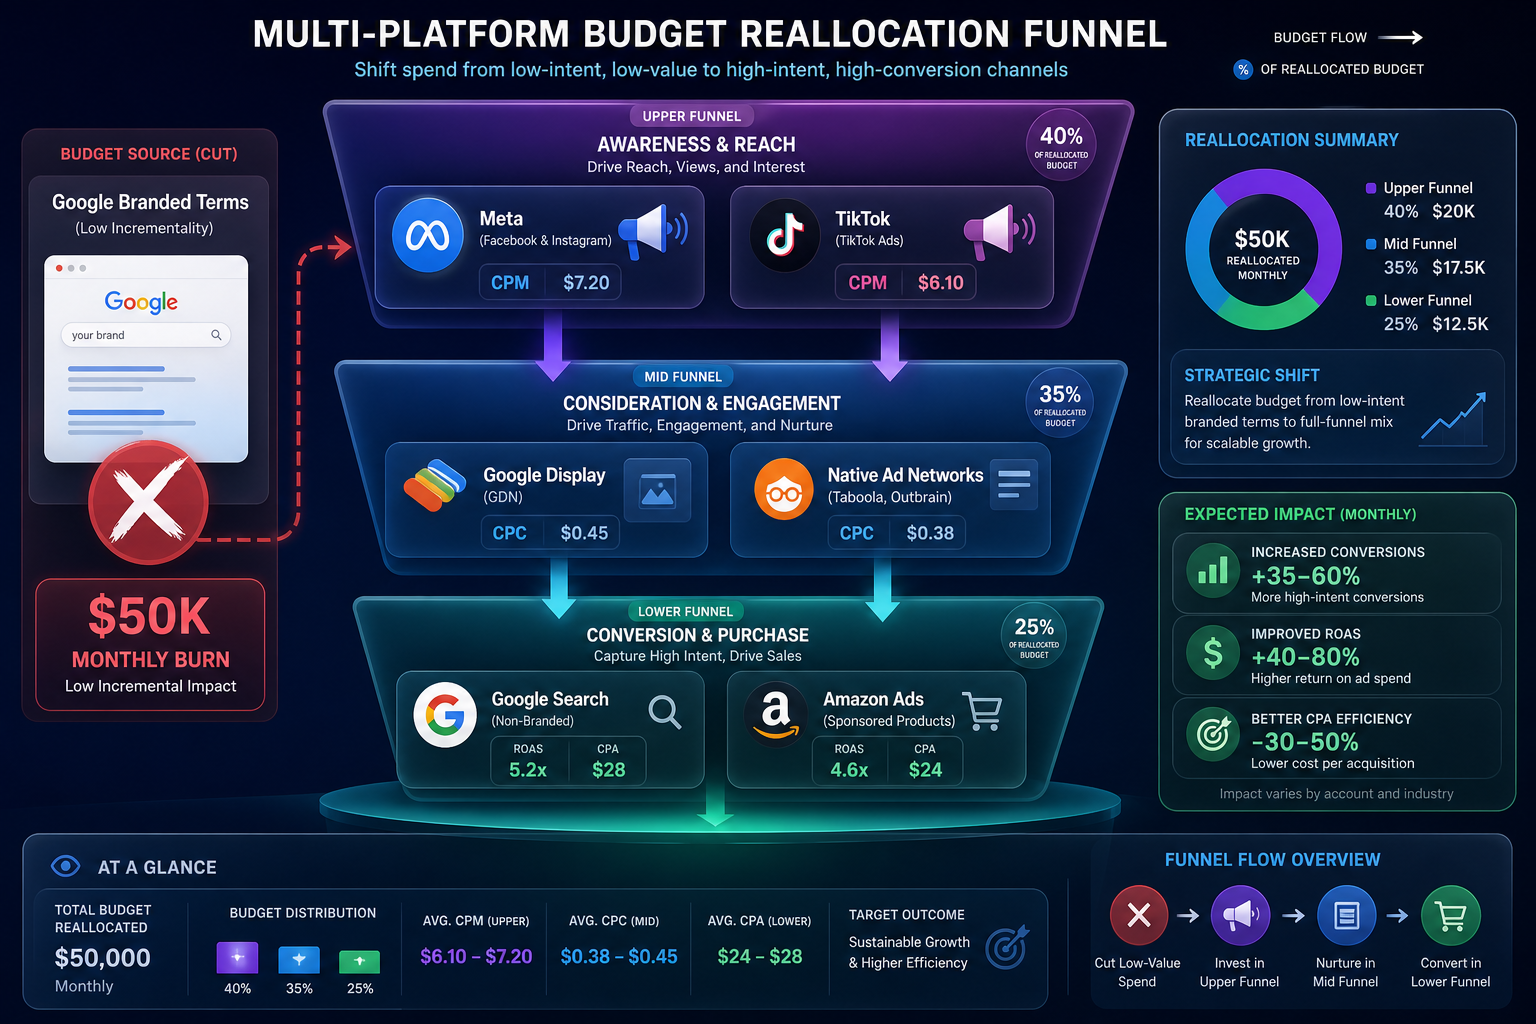
## Budget Reallocation: From Google to Meta, TikTok, and Amazon Navigo’s solution for Esker involved three steps: 1. Reduce Google spend on branded terms and reallocate it to top-of-funnel campaigns. 2. Move the upper funnel to Meta and TikTok — platforms that generate new demand rather than intercepting existing intent. 3. Use Amazon and Ulta for the lower funnel — where users are already ready to buy — while keeping Google for the final intent stage. This is the connected commerce model: not a single platform for everything, but an ecosystem of channels, each solving a specific task. For media buyers and affiliate marketers, the logic is similar: | Funnel Stage | Platform | Objective | Metric | |—|—|—|—|| Upper | Meta, TikTok, YouTube Shorts | Demand generation, reach | CPM, CTR, views | | Middle | Google Display, native ads | Warming up, remarketing (moderate) | CPC, engagement depth | | Lower | Google Search (non-brand), Amazon, landing pages | Conversion | CPA, ROAS | The key mistake is using one platform for all funnel stages. Google Search excels at the lower funnel (high intent) but falls short at the top (generating new demand). Meta and TikTok, conversely, are highly effective for reach but require a different attribution model. ## Retargeting: When Frequency Kills ROAS The second issue Navigo identified with Esker was aggressive retargeting. Campaigns that: – retargeted the same audiences too frequently; – targeted existing customers; – ran in GEOs where new customer growth had stalled. All three patterns burn budget with zero incremental results. Retargeting existing customers only makes sense in specific scenarios: upselling, cross-selling, or reactivating long-inactive users. If you’re showing ads to someone who purchased a week ago, you aren’t influencing their decision — you’re just wasting money. ### Ad Frequency: Benchmarks For media buyers, frequency is one of the most underrated metrics. General benchmarks: – 1–3 impressions per week per user — sufficient for brand awareness without ad fatigue. – 4–7 impressions — a danger zone, especially if there are no conversions. – 8+ impressions — almost guaranteed audience burnout and rising CPCs as CTR drops. In affiliate media buying, frequency is critical on native networks and in Meta. If you’re driving traffic through Taboola or Outbrain and aren’t controlling frequency by placement, you’re paying for impressions shown to users who have already seen your ad 10 times and didn’t click. ## Practical Scenarios for Media Buyers and Affiliates ### Scenario 1: Google Ads as the Sole Channel If you operate exclusively through Google Ads (Search or Performance Max), check: – The share of branded traffic in your total conversions. If it’s over 30%, you’re overinvesting in interception rather than acquisition. – Performance Max incrementality. PMax blends branded and non-branded traffic in a single report. Use brand reports and compare them with periods when PMax was paused. – Search Terms Report for exact matches. If a significant portion of impressions comes from your brand or its variations, pause them or isolate them into a separate campaign with a limited budget. ### Scenario 2: Multi-Channel Media Buying If you’re running traffic across multiple sources (Google, Meta, native networks, push): – Isolate attribution by channel. UTM tagging is mandatory but insufficient — use server-side tracking or Conversion APIs to avoid losing data due to browser restrictions. – Don’t duplicate audiences across channels. If you retarget in Google users who came from Meta, you create cross-channel cannibalization. Exclude audiences. – Test upper-funnel campaigns in Meta/TikTok with an expectation of delayed conversions. Don’t evaluate top-funnel campaigns based on Day 1 ROAS — allow a 7–14 day attribution window. ### Scenario 3: Affiliate Offers and CPA Networks In affiliate marketing, the K-shaped economy is particularly brutal: top offers in popular verticals (iGaming, finance, nutra) become increasingly expensive, while niche offers remain accessible but require more testing. – Monitor CPA trends for offers. If CPA rises by 20%+ in a quarter, competition has either spiked or the offer is overheated. – Test new GEOs. K-shaped dynamics mean demand grows in some regions while dropping in others. Test Tier-2 and Tier-3 GEOs with lower bids. – Diversify your traffic sources. If 80% of traffic comes from one source, you’re vulnerable to algorithm or policy changes. ## Metrics to Track When Reallocating Your Budget ### Incremental ROAS vs. Reported ROAS Reported ROAS is all conversions divided by spend. Incremental ROAS represents conversions that would not have happened without ads. The difference between them is the measure of cannibalization. To measure incrementality: – Geo-tests: pause ads in one region, compare with a control region. – Holdout groups: exclude 10% of your audience from targeting and compare their conversions with the rest. – Time-series analysis: compare conversions before and after pausing a campaign, factoring in seasonality. ### Cost per Incremental Conversion (CPIC) CPIC = spend / incremental conversions. If CPIC is significantly higher than CPA, you’re overpaying for conversions you would have acquired organically. ### Search Share of Voice (SOV) For Google Ads: the percentage of impressions for your keywords that come from your ads. If SOV is high but conversions aren’t growing, you’ve hit a ceiling and need to expand your keyword semantics or switch channels. ## Budget Reallocation Mistakes 1. Abruptly pausing all campaigns. Reallocation should be gradual — first cut by 30–50%, measure the impact, then proceed. 2. Ignoring the attribution window. If you pause Google and shift funds to Meta, conversions might “surface” in Meta after 7–14 days. Don’t draw conclusions on day one. 3. Shifting budget without updating creatives. Creatives that worked in Google Search (text ads) won’t work in Meta or TikTok. You need visual formats tailored to the platform. 4. Failing to isolate branded traffic. If you haven’t separated branded campaigns, you won’t know how much money is going toward cannibalization. 5. Being too narrowly focused on one offer/product. Navigo advised Esker to focus on high-conversion SKUs. In affiliate marketing, it’s the same: don’t dump your entire budget into one offer; diversify. ## Connected Commerce Strategy for Media Buyers Connected commerce isn’t just multi-channel marketing; it’s coordinated channel management where each channel serves its purpose and data is synchronized across them. For media buyers, this means: – A unified audience across platforms (via Customer Match, lookalikes, Conversion APIs). – Eliminating overlaps (not showing ads to the same people simultaneously on Google and Meta). – Isolating branded traffic into a separate campaign with a minimal budget. – Distinct KPIs for each funnel stage: upper — CPM and reach; middle — CPC and engagement; lower — CPA and ROAS. In affiliate media buying, connected commerce is rarer, but the principles remain: don’t run a single offer through a single source. Build an ecosystem of 2–3 sources with different objectives.
Checklist: Ad Budget Audit and Reallocation
- Check your branded traffic share in Google Ads — if it’s over 30%, isolate it into a separate campaign with a limited budget
- Run a geo-test: pause branded ads in one region for 14 days and compare total conversions with a control region
- Analyze your Search Terms Report — exclude exact brand matches from your main campaigns
- Check ad frequency in Meta and native networks — cut back on anything exceeding 7 impressions per week
- Reallocate 20–30% of your Google Search budget to Meta/TikTok for upper-funnel activities and measure the results after 14 days
- Exclude audience overlaps between channels — don’t retarget in Google users who came from Meta
- Separate KPIs by funnel stage: upper — CPM and reach; lower — CPA and incremental ROAS
## FAQ
FAQ
What is a K-shaped ad economy?
A K-shaped economy is a macro-pattern where different market segments move in opposite directions. In advertising, it means top categories and major brands grow faster than the overall market, while mid-tier and niche players stagnate. According to MediaPost, the overall market grew by 1.9%, while the top 10 categories grew by 4%.
Pause your branded campaign in one region for 7–14 days and compare total conversions (organic + paid) with a control region. If conversions didn’t drop, your ads were cannibalizing organic traffic. Also, check your Search Terms Report: if 80%+ of impressions are exact brand matches, you’re paying for interception, not acquisition.
What is a normal retargeting frequency?
A good benchmark is 1–3 impressions per week per user for awareness. 4–7 impressions is a risk zone, especially without conversions. 8+ impressions almost guarantees audience burnout: CTR drops, CPCs rise, and your budget is wasted. In Meta, use frequency capping; in Google, exclude users who have already converted.
How do I reallocate budget between Google and Meta without losing conversions?
Do it gradually: first cut Google spend by 20–30%, shift it to Meta with new (visual, not text) creatives. Set a 7–14 day attribution window and don’t draw conclusions on day one. Exclude audience overlaps between channels. Measure incremental ROAS, not just reported ROAS.
Do these principles apply to affiliate media buying?
Yes. In affiliate marketing, a similar trap is paying for traffic to landing pages that already receive organic or referral traffic. Isolate your sources using UTM tags and server-side tracking. Diversify your sources: don’t push 80% of traffic through one channel. Test Tier-2 and Tier-3 GEOs where competition is lower.